Infographics
Information Design is the Visual representation of information, specifically the visual communication of complex idea(s).


Quick Tips
Don’t emphasize everything.
Prioritize the information that you are trying to communicate. You can always repeat the infographic with different sections highlighted.
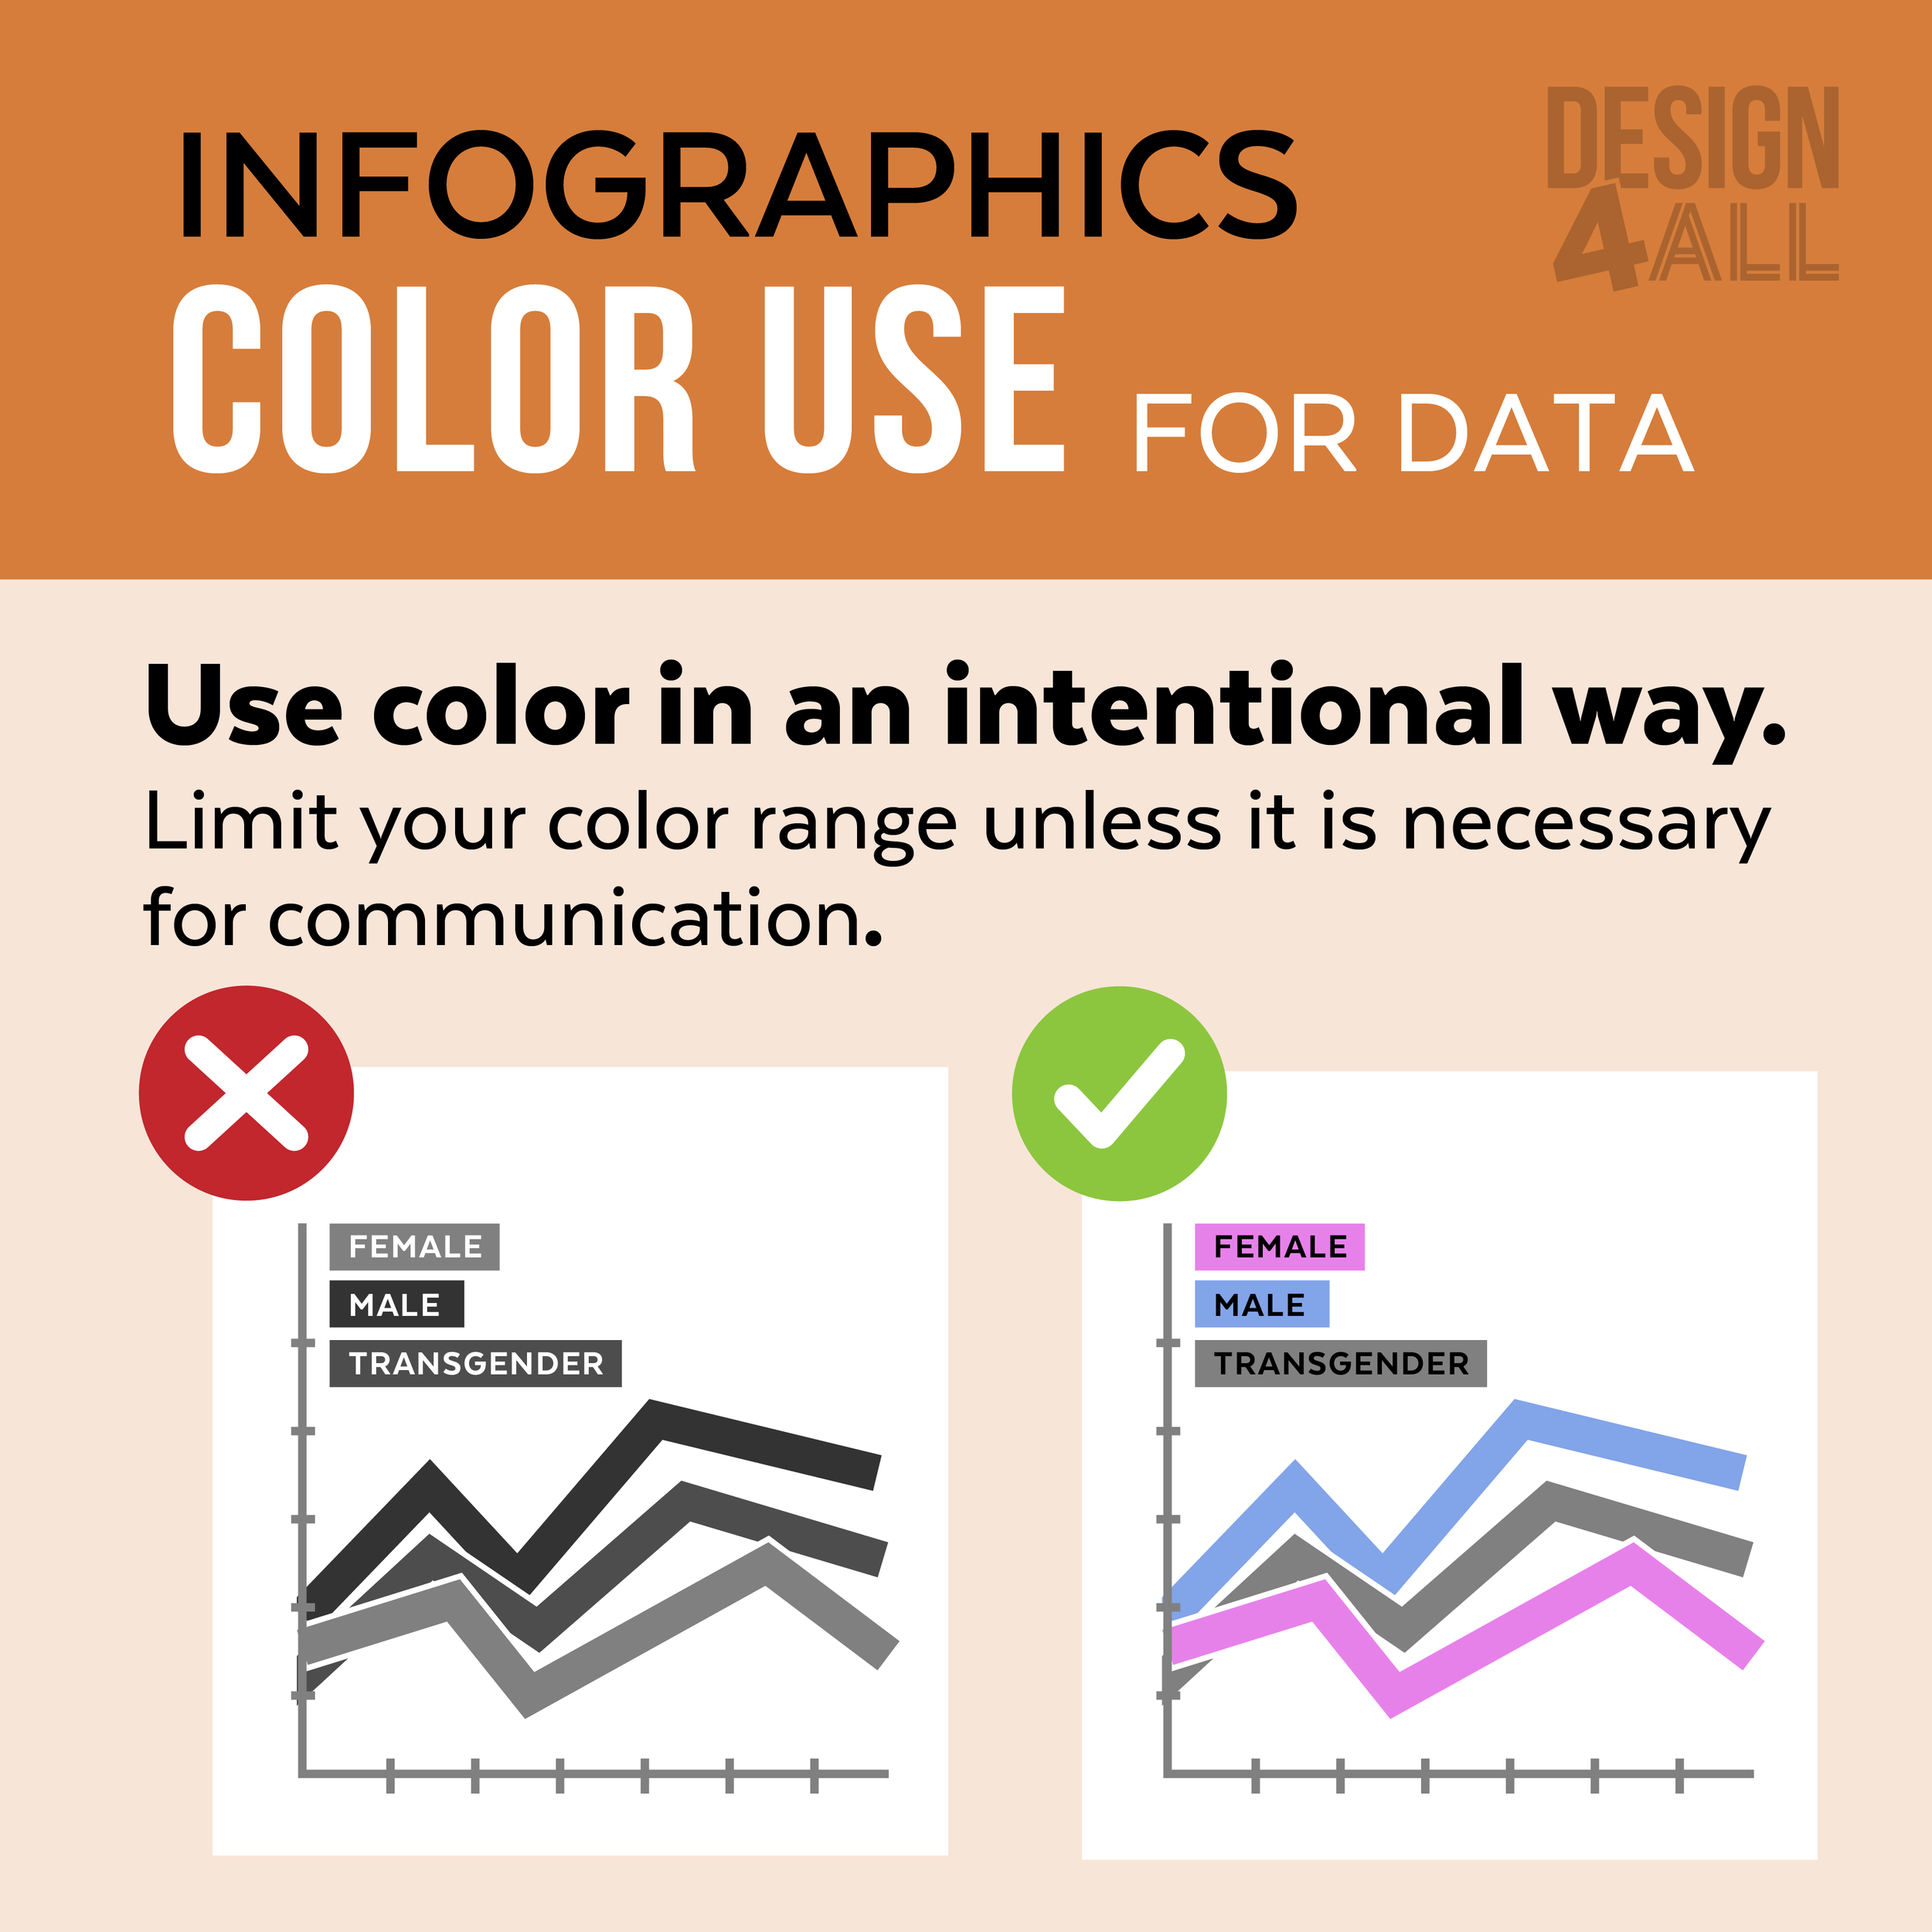
Use Color in an intentional way.
Limit your color range unless it is necessary for communication.
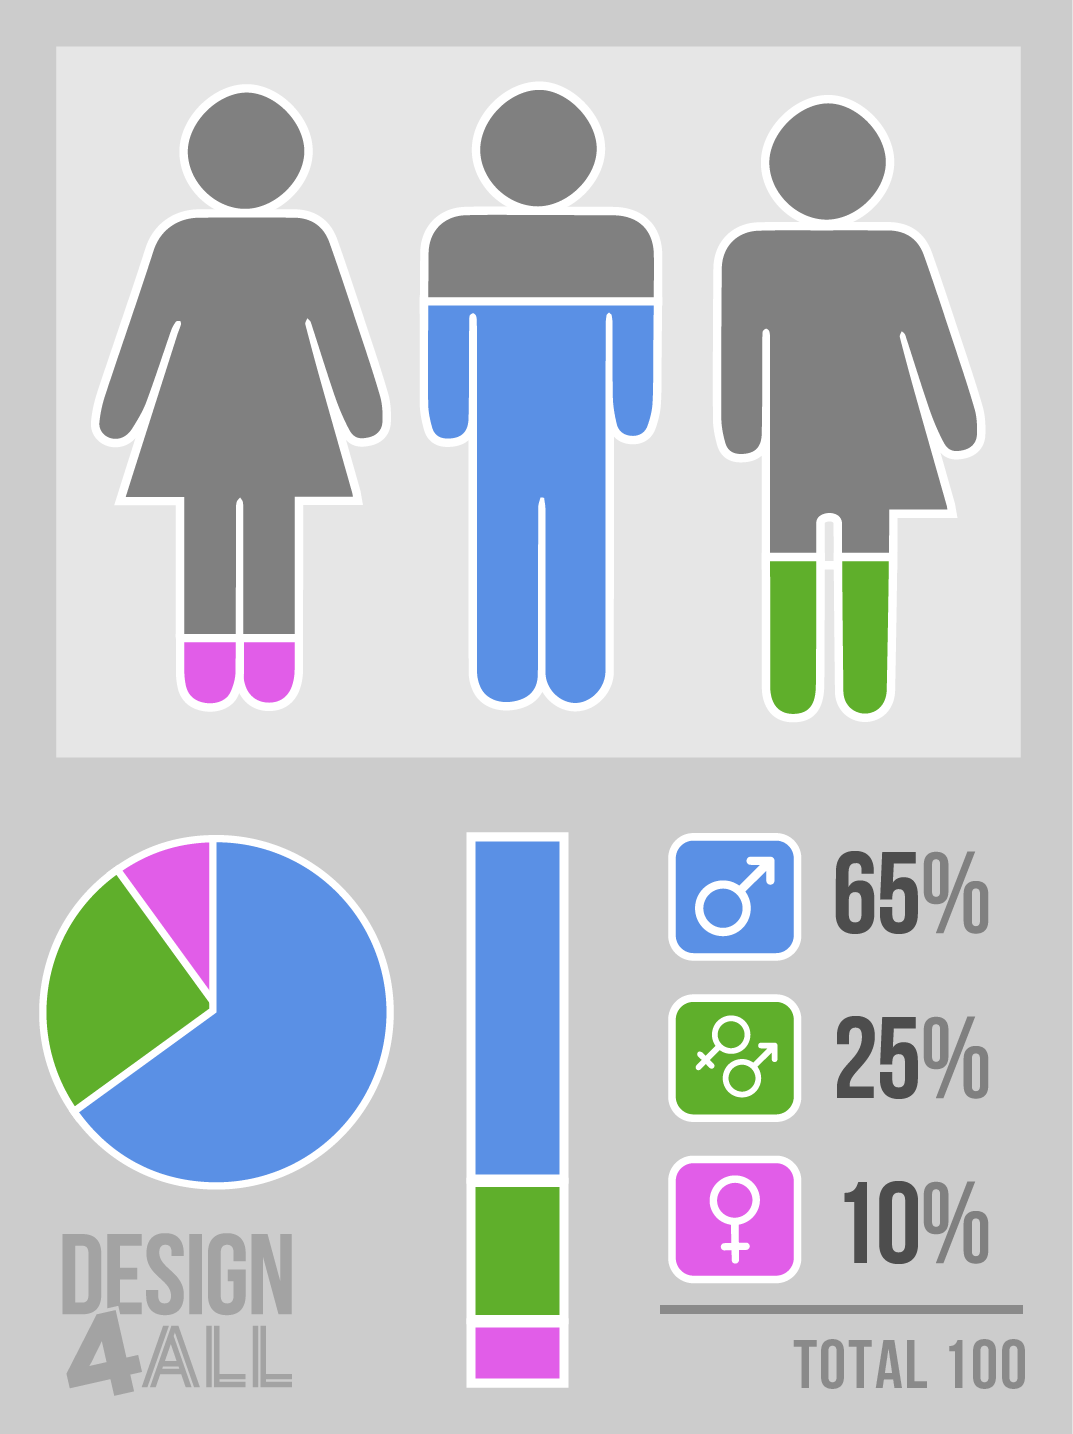
Use Icons to create quick context clues.
Icons that relate to your results are helpful for reader engagement and content comprehension.
Context
Provide Context by comparing data results with relatable content.
100 yards = Football Field
1 KB of data = Amount of information in half a typewritten page
1 MB of data = Amount of information in a small novel
Proportion
Graphics use size or area to show differences or similarities between values for parts to a whole.

Comparison
Graphics that help show the differences or similarities between values.
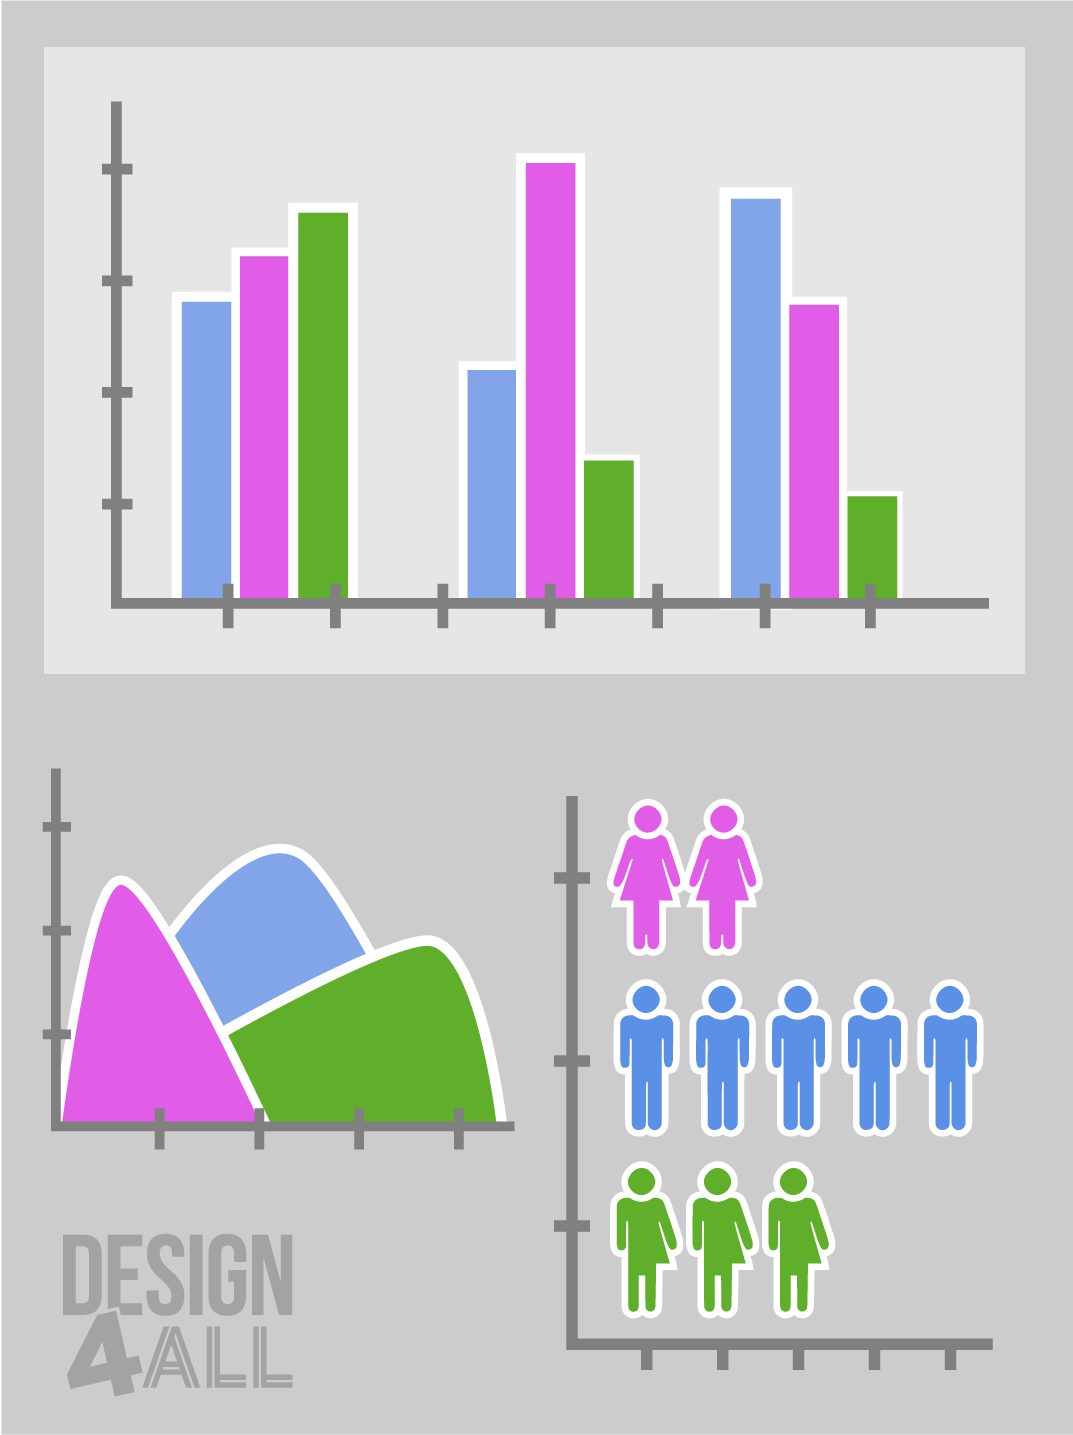
Distribution
Graphics display frequency, how data spread out over an interval or is grouped.

Relationships
Graphics show relationships and connections between the data or show correlations between two or more variables.
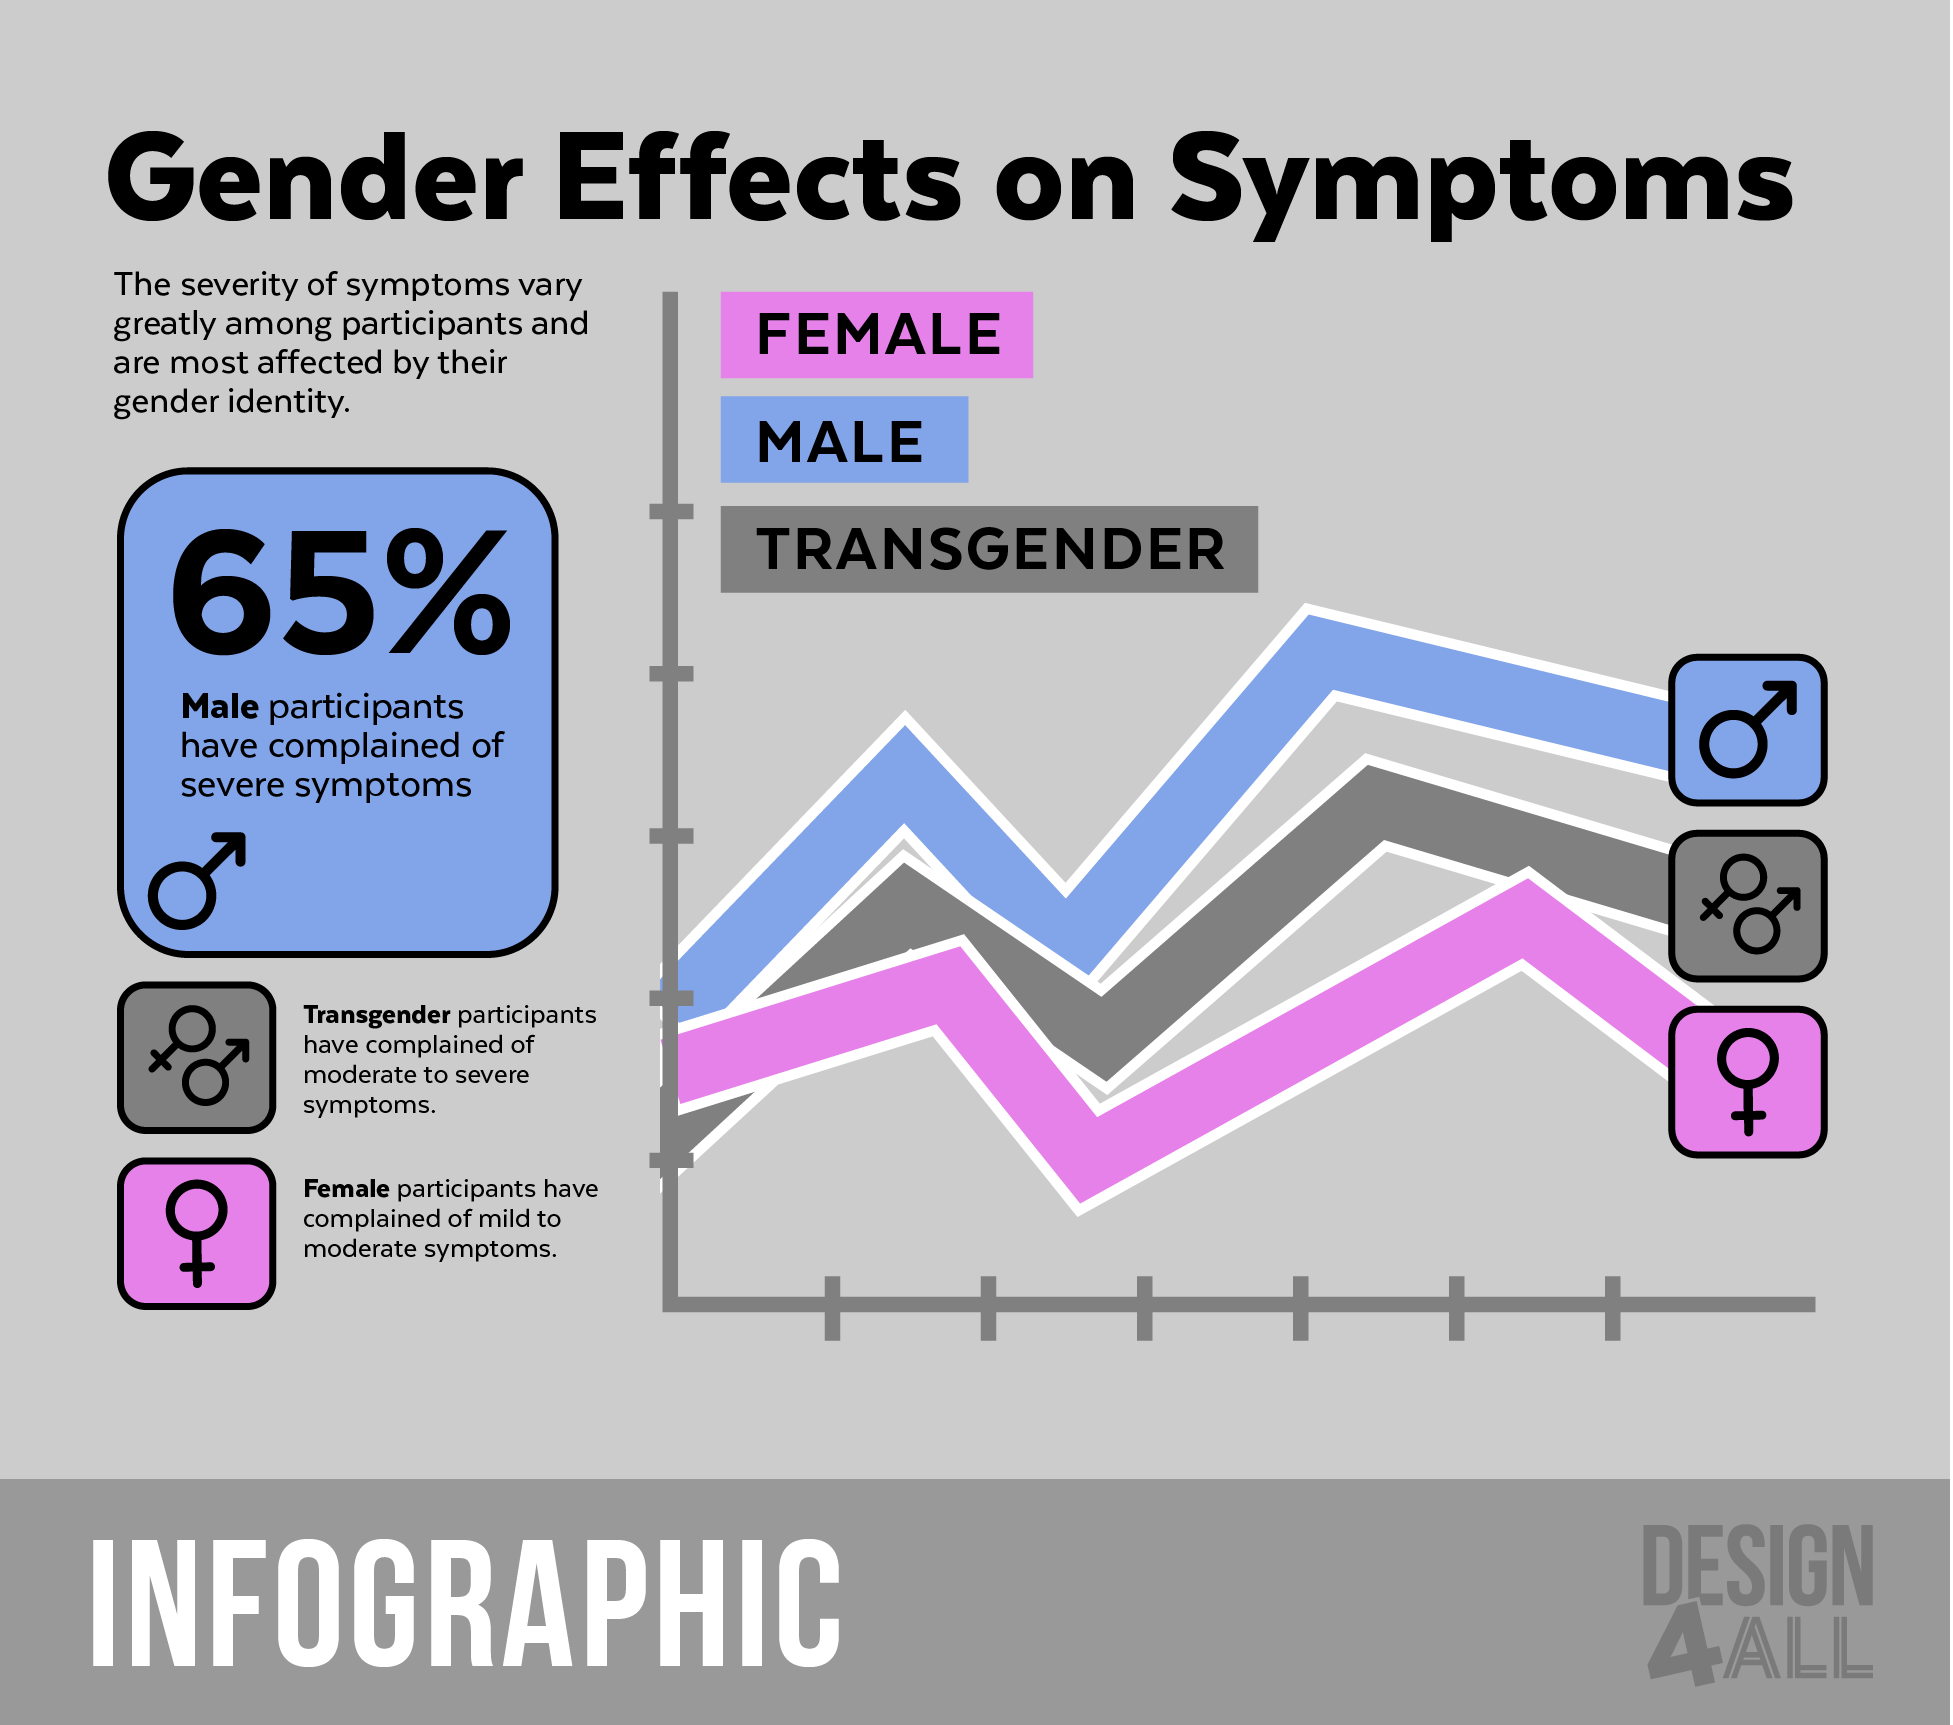
Infographics
Infographics are generally created for the purpose of explaining a specific topic. They may include data visualizations, but it is not required.
Subjective: Data can be shown in the Infographic, but the interpretation of the data is also included by the designer, as well as additional graphics and text.

Data Visualization
Data Visualization information will be quantifiable, and therefore in the form of numbers. This includes graphs and charts.
Objective: Data is shown objectively without any interpretation by the designer.

Need help choosing the right type of graphic?
Easily review different types of data visualizations to find the right one for your data!

Design Software
Design Software
There is affordable and helpful design software available to use for designing Research Posters and Informational Graphics.
Canva.com (Free Versions)
Piktochart.com (Free Versions)
Adobe® Express (Free Versions)
Microsoft® PowerPoint
